Fiona Ottaviani and Anne Le Roy - The Conversation

Fiona Ottaviani, Grenoble École de Management (GEM) et Anne Le Roy, Université Grenoble Alpes
Across international, European, national and local scales, the emergence of new socio-environmental indicators highlights the need to develop appropriate measurement strategies.
A local experimentation to design indicators of well-being
In France, the limitations of existing data for assessing and planning public initiatives led a number of professionals in the Grenoble metropolitan area to look at what could be hidden from existing data, notably for social and environmental aspects.
A collective of urban-policy stakeholders and researchers from Grenoble University came together to question conventional local observation tools and develop a new approach. The Grenoble project’s sustainable territorial social indicators – Indicateurs de bien-etre sociaux territorialisés (IBEST) in French – are now being tested in select regional municipalities.
A bottom-up approach
The Grenoble project opted for a bottom-up approach. It was based on data on individual-level living conditions so as to arrive to a collective expression of what the common good represents. The IBEST experimentation used two coordinated methodologies:
-
Quantitative survey: A survey of individual well-being and achievements from a capabilities standpoint. It provides an understanding of people’s living conditions and their aspirations on a personal level.
-
Participative approach: A forum for discussions between the stakeholders on the aspects relating to the common good.
Three arguments support the complementarity of the two methodologies. First, we need to provide a sound basis for collective discussions. Second, social and environmental sustainability aspects are highly political questions. Although social sustainability involves social-justice considerations, it is also related to types of social interactions and everyone’s ability to participate in the forum. Finally, an expert cannot unilaterally decide on the relevant categories given that the purpose of the approach is to draw up indicators that collectively make “sense” to the various stakeholders (elected officials, residents, voluntary organisations, professionals and researchers).
The quantitative survey: the individual well-being
The quantitative survey was presented to 1,000 people in the Grenoble urban area by telephone in November 2012. They were asked about the social dimensions of their living conditions so as to highlight factors that influence their well-being. The sample was distributed in eight standard urban districts, and included 28 towns. The sample was representative in terms of gender, age and socio-professional group at the scale of each sector.
The data produced can be used for a variety of processes and interpretations, which imply theoretical and methodological choices that are not neutral. One of the advantages of the survey is to avoid the division between subjective and objective approaches, by focusing on the coordination of “subjective” data regarding individuals’ perception of their situation and environment with “objective” data relating to their social situation.
The wide range of opinions expressed cannot supplant political debate with citizens, however, despite their social roots. One of the arguments in favour of this stance is that preferences are social constructions and that the issues of well-being and participation are political. Accordingly, a participative methodology is more appropriately conceived to administer this collective discussion.
The participative approach: the common good
The participative approach aims to establish a transition from an individual concept of well-being to a collective concept of the common good focused on social and environmental sustainability. It was intended encourage the stakeholders to better understand the intermediary results of the quantitative survey.
Two factors explain this methodological and conceptual sequence. On one hand, the idea that you need to rely on empirical materials and start from each person’s experience of well-being to further involve people in the process, rather than being limited to “hollow” generalities. On the other hand, the need to articulate a design in terms of well-being, common good and sustainability.
Overall, the participative approach that was divided into three separate stages.
-
The European Council’s SPIRAL methodology, which was launched among local stakeholders in at the start of 2013, enabled us to disseminate a review of well-being among those stakeholders, and make them want to be involved in reviewing the alternative indicators.
-
Three workshops for, respectively, members of the public, professionals and elected officials, were organised during the autumn of 2013. The aim was to enable each group to issue a collective opinion on what matters and has an influence on their well-being, based on the intermediary results. The first workshop included 16 area residents from a range of social and geographical backgrounds. The second consisted of 15 professionals and people working with volunteer organisations. The workshop for elected officials provided individual opinions rather than a collective response; the spring 2014 elections were undoubtedly an important factor in this case.
-
All these stakeholders were brought together as part of a hybrid forum in early December 2013. It allowed each of the three groups to present their findings, and was followed by a period of collective discussion.
The results of the quantitative survey were reworked on the basis of the entire participative approach. The aim is that the statistical categories, on the basis of which the indicators were designed, are not just simply produced by the experts. Including the “social categories” that emerged during the collective discussion periods is essential.
Eight dimensions of sustainable well-being
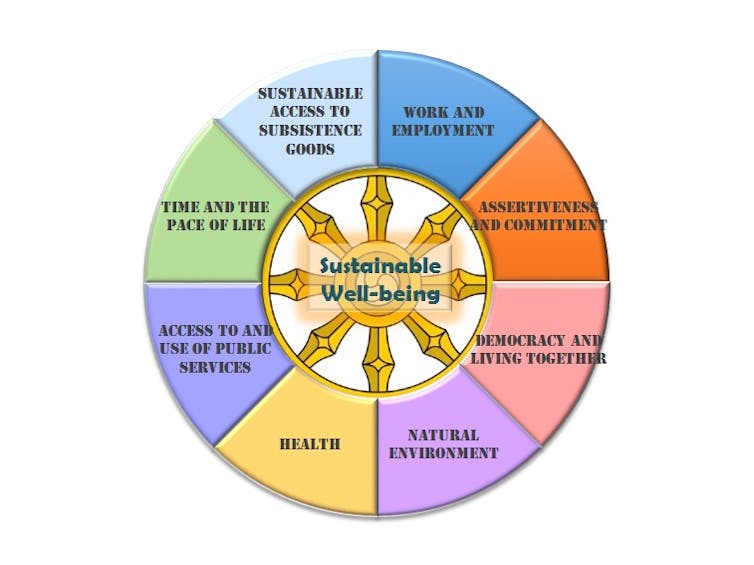
Eight dimensions were derived: (1) work and employment, (2) assertiveness and commitment, (3) democracy and living together, (4) natural environment, (5) health, (6) access to and use of public services, (7) time and the pace of life and (8) sustainable access to subsistence goods.
The dashboard of sustainable well-being is composed of 28 indicators. They originate from both administrative sources (income inequality, air quality index, water quality, rate of soil erosion, proportion of empty homes) and data from the IBEST study. The use of two different data sources adds value to the research, but at the same time it may constrain the possibilities for analysis. The use of administrative data is justified in order to acquire information about some aspects that are missing in the investigation, including some sustainability elements.
Some indicators are common with other experiments conducted around alternative indicators. The comparison of the selected indicators as part of the construction IBEST is based on: (1) the quality-of-life indicators designed by INSEE; (2) capability indicators in Lorraine region; (3) new indicators of wealth in the Loire region; (4) the social health indicator from the Nord-Pas-de-Calais region.
No indicator is shared with the ten recently proposed by France Strategy, which were cited in the discussion on wealth indicators that took place in the French National Assembly.
Comparison of IBEST indicators with other alternative indicators
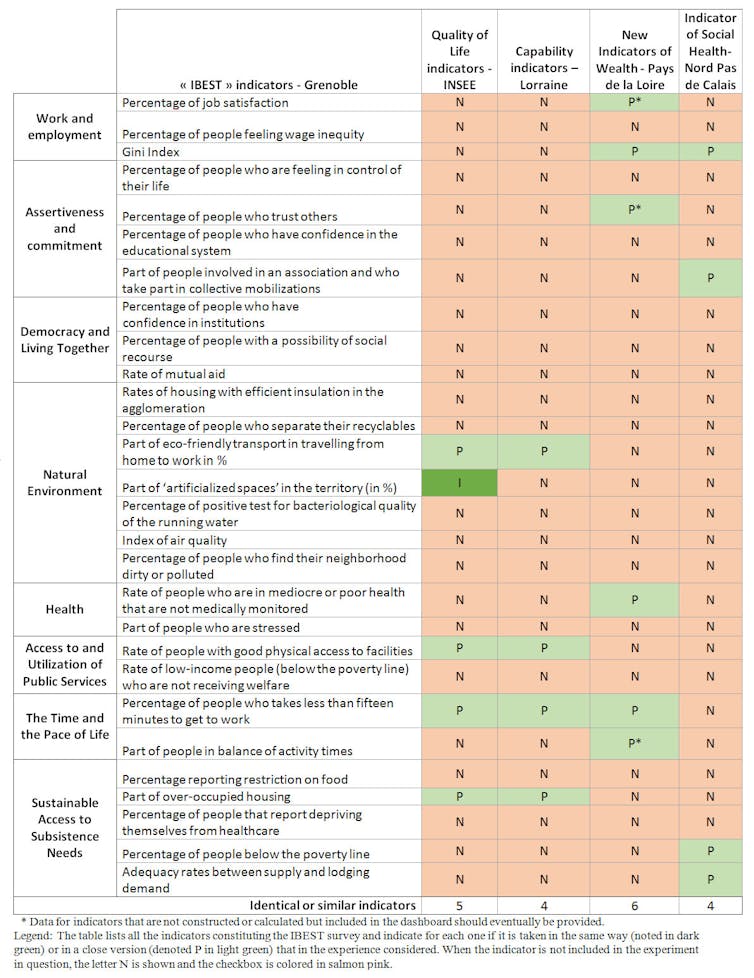
Comparing these four experiments with those of IBEST reveals that 13 out of 28 indicators have been used in similar or identical releases in other alternative-indicator experiments. IBEST also shares at least four indicators with each of these. IBEST shares the most common indicators with the Loire region’s wealth indicators. Furthermore, these two experiments include a participatory approach. Therefore, the influence of the participatory approach on conformation indicators, rather than the mobilised concepts, can explain such proximity.
However, three kinds of indicators appear specific to IBEST, and demonstrate the contribution of its dashboard:
-
Indicators on the perception that people have of their environment (trust in others, trust in institutions) are rarely encountered in other experiments, regardless of how essential they are to understanding the non-monetary resources and obstacles to the achievement of individuals and environmental conservation;
-
Indicators related to social sustainability (social action, restrictions, etc.) are often assimilated to the offer of services in the territory, without taking into account the needs of the populations;
-
Indicators dedicated to environmental sustainability (air quality, water quality, etc.) are often studied independently of the social aspects of sustainability.
The fact that these kinds of indicators end up in some other experiences of alternative indicators demonstrate the persistence in France of a separation between the so-called objective and subjective approaches, as well as approaches that take into account the social dimensions and others that are focused on the environmental dimension.
![]() These separations appear problematic, as they tend to obscure the interactions between the perception that people has of their environment and the state of their social situation. It overlooks the link between social sustainability and environmental sustainability. In this sense, the dashboard of sustainable territorialized well-being is a synthesis of these different approaches and delivers a synoptic vision of sustainable well-being in the urban area.
These separations appear problematic, as they tend to obscure the interactions between the perception that people has of their environment and the state of their social situation. It overlooks the link between social sustainability and environmental sustainability. In this sense, the dashboard of sustainable territorialized well-being is a synthesis of these different approaches and delivers a synoptic vision of sustainable well-being in the urban area.
Fiona Ottaviani, Enseignante-chercheuse en économie - Chaire Mindfulness, Bien-être au travail et Paix économique - Political Economy and Sustainable Competitiveness Initiative - Chercheuse associée au CREG - UGA, Grenoble École de Management (GEM) et Anne Le Roy, Enseignante chercheuse en Economie au CREG à l'UGA, Université Grenoble Alpes
La version originale de cet article a été publiée sur The Conversation.